Lab 02 - LIDAR: Cones detection
Robotics II
Poznan University of Technology, Institute of Robotics and Machine Intelligence
![]()
Laboratory 2: Cones detection using LIDAR sensor
Back to the course table of contents
1. Introduction to LIDAR sensor
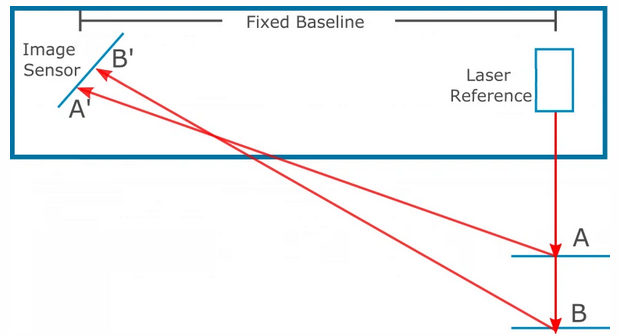
The laser scanner is a sensor that emits an infrared beam and then records the reflection of a given beam. There are 3 common ways how sensors work: - triangulation - laser emits beam and camera receiver checks the difference in the distance as changes in an angle of the received signal. Unequal measurement - closer distances are more accurately measured. Limited range of sensor due to base size and position. Image reference: How Do 3D Scanners Work?.
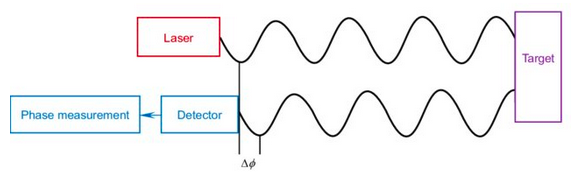
- amplitude-modulated continuous wave (AMCW) - continuous emitting of the laser beam with signal amplitude modulation. Distance is measured as the phase difference between signals emitted and received. Unambiguous results only for range 0 to 2π. The sensor range can be extended at the cost of reduced resolution. The figure below illustrates method of a measurement (image reference Review of advances in LiDAR detection and 3D imaging).
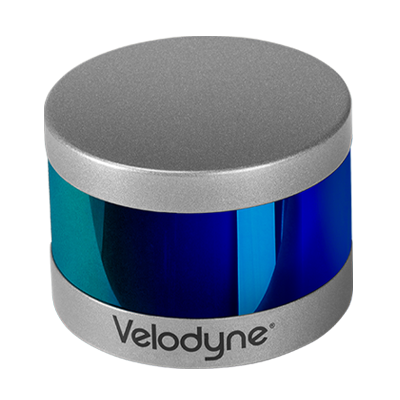
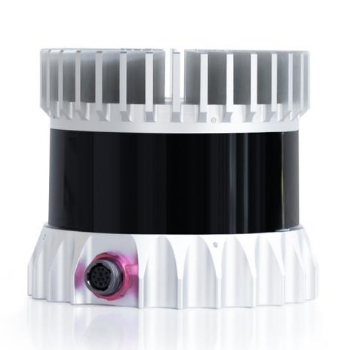
- time-of-flight (ToF) - sensor measures the time difference between the emission of a beam and its receiving. Accuracy is not dependent on distance to an obstacle.
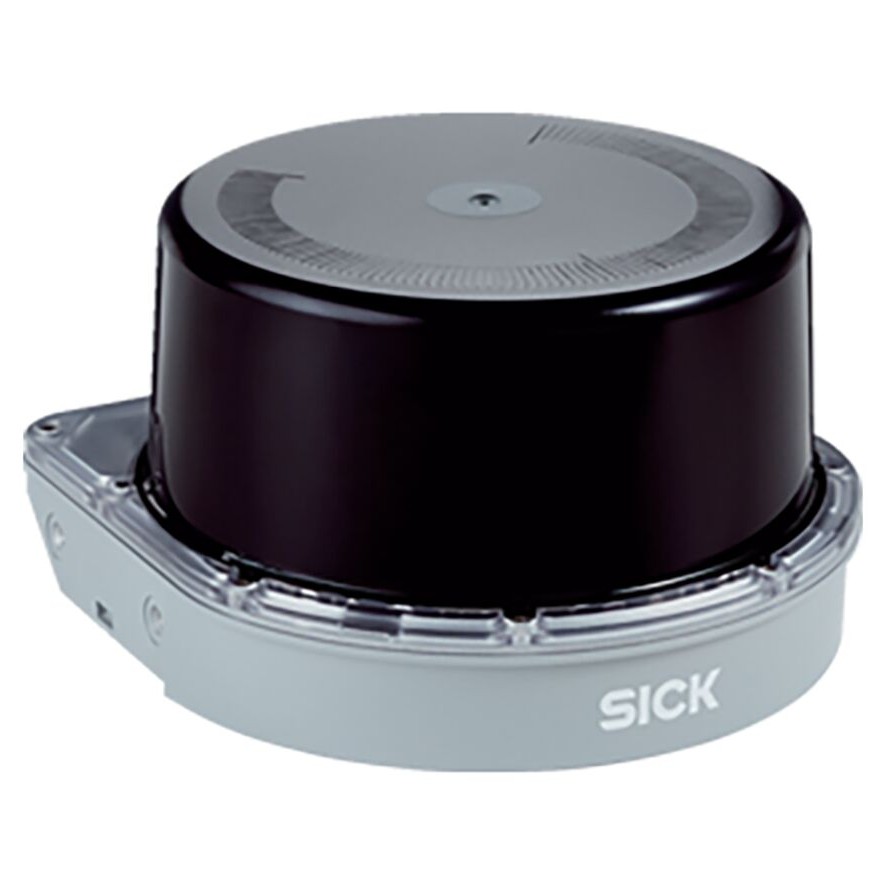
Below are shown examples of 3D laser scanners which use the ToF method - accordingly Velodyne VLP-16, Ouster OS1, and SICK MRS1000.
2. PointCloud2 Message (ROS 2)
In ROS 2, lidar data is typically published as:
- Message type:
sensor_msgs/msg/PointCloud2
Show message definition:
ros2 interface show sensor_msgs/msg/PointCloud2# This message holds a collection of N-dimensional points, which may
# contain additional information such as normals, intensity, etc. The
# point data is stored as a binary blob, its layout described by the
# contents of the "fields" array.
#
# The point cloud data may be organized 2d (image-like) or 1d (unordered).
# Point clouds organized as 2d images may be produced by camera depth sensors
# such as stereo or time-of-flight.
# Time of sensor data acquisition, and the coordinate frame ID (for 3d points).
std_msgs/Header header
builtin_interfaces/Time stamp
int32 sec
uint32 nanosec
string frame_id
# 2D structure of the point cloud. If the cloud is unordered, height is
# 1 and width is the length of the point cloud.
uint32 height
uint32 width
# Describes the channels and their layout in the binary data blob.
PointField[] fields
uint8 INT8 = 1
uint8 UINT8 = 2
uint8 INT16 = 3
uint8 UINT16 = 4
uint8 INT32 = 5
uint8 UINT32 = 6
uint8 FLOAT32 = 7
uint8 FLOAT64 = 8
string name #
uint32 offset #
uint8 datatype #
uint32 count #
bool is_bigendian # Is this data bigendian?
uint32 point_step # Length of a point in bytes
uint32 row_step # Length of a row in bytes
uint8[] data # Actual point data, size is (row_step*height)
bool is_dense # True if there are no invalid points
3. Tasks
At the beginning
Start the docker compose setup (from the directory with docker-compose.yml):
Enter the ROS2 container:
docker compose exec fsds-ros2 bashLaunch fsds_ros2_bridge.launch.py
Open new terminal and also enter to ROS2 container.
Inspect lidar PointCloud2 topic (ROS 2)
List topics:
bash ros2 topic listFind the lidar topic (examples; yours may differ):/fsds/lidar/Lidar1Check topic type:
bash ros2 topic info <LIDAR_TOPIC>Echo one message:ros2 topic echo <LIDAR_TOPIC> --onceCheck frequency:ros2 topic hz <LIDAR_TOPIC>Compare message content vs settings.json in FSDS: ``` number of channels / beamspoints per second
range / FOV ``` what fields exist in PointCloud2 (x,y,z,intensity etc.). Check how many laser beams are used, points are recived and which different data fields are in message. AirSim lidar configuration is available on Docs » Using AirSim » Sensors » LIDAR.
Task
- Implement
find_conesmethod
Using the pseudo-code shown below, implement the
find_cones method in your ROS 2 node
(lidar_detector.py).
The goal is to: - group close points from the lidar scan, - convert
each group into a cone position, - remove cones that are farther than
cones_range_cutoff.
Pseudo-code to follow exactly:
cone <- []
current_group <- []

i <- 0
previous_point <- points[i]

FOR 1 TO len(points)
  i <- i + 1
  current_point <- points[i]

  distance_to_last_point <- distance(current_point_x, current_point_y, previous_point_x, previous_point_y)

  IF distance_to_last_point < 0.1
    current_group.append(current_point)
  ELSE
    IF current_group > 0
      cone <- points_group_to_cone(current_group)

      distance_to_cone <- distance(0, 0, cone_position_x, cone_position_y)

      IF distance_to_cone < cones_range_cutoff
        cones.append(cone)

      current_group <- []

      ENDIF
    ENDIF
  ENDIF

  previous_point <- current_point
ENDFOR
Requirements: - Iterate through lidar points in order. - Use a
distance threshold of 0.1 meters to decide if points belong
to the same group. - When the distance condition is no longer satisfied,
close the current group. - Convert each valid group into a cone
position. - Keep only cones within cones_range_cutoff.
2. Implement distance
function
In the same file, implement the distance function.
It must calculate the Euclidean distance between two points in the XY plane:
- Ignore the Z coordinate.
- Use the formula:
distance =\(\sqrt{(x2 - x1)^2 + (y2 - y1)^2}\)
The function should take four arguments: -
x1, y1, x2, y2 - and return a single float value.
3. Implement
points_group_to_cone
Create a function points_group_to_cone(points_group)
that:
- Receives a group of points belonging to one cone.
- Computes:
points_group_average_xpoints_group_average_y
- Assigns these values to:
pose.position.xpose.position.y
- Sets
pose.position.z = 0.0 - Returns a
Poseobject.
The average position represents the center of the detected cone.
4. To do task
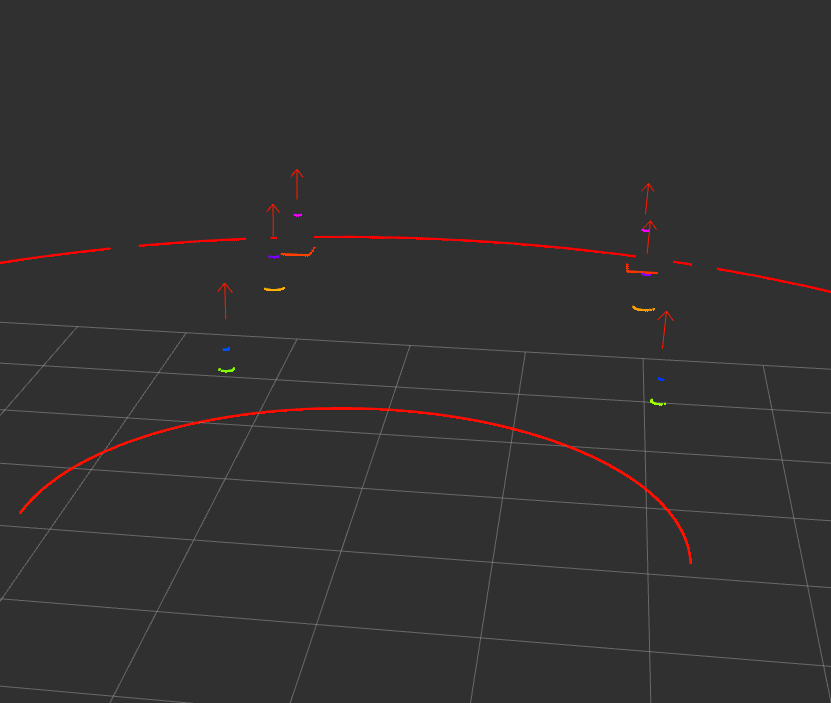
Add to the eKursy platform screenshot of Rviz2 viewer with added PointCloud2 message from Lidar sensor, Pose Array with detected cones (colored arrows in the center of the detected cone - as figure above) and your lidar_detector.py file.